- Download Ikshana app from link below
NDVI analysis using Satellite Imagery
July, 3 2022
- Posted by: Avesh
NDVI analysis using Satellite Imagery
Remote sensing phenology studies use data gathered by satellite sensors that measure wavelengths of light absorbed and reflected by green plants. Certain pigments in plant leaves strongly absorb wavelengths of visible (red) light. The leaves themselves strongly reflect wavelengths of near-infrared light, which is invisible to human eyes. As a plant canopy changes from early spring growth to late-season maturity and senescence, these reflectance properties also change
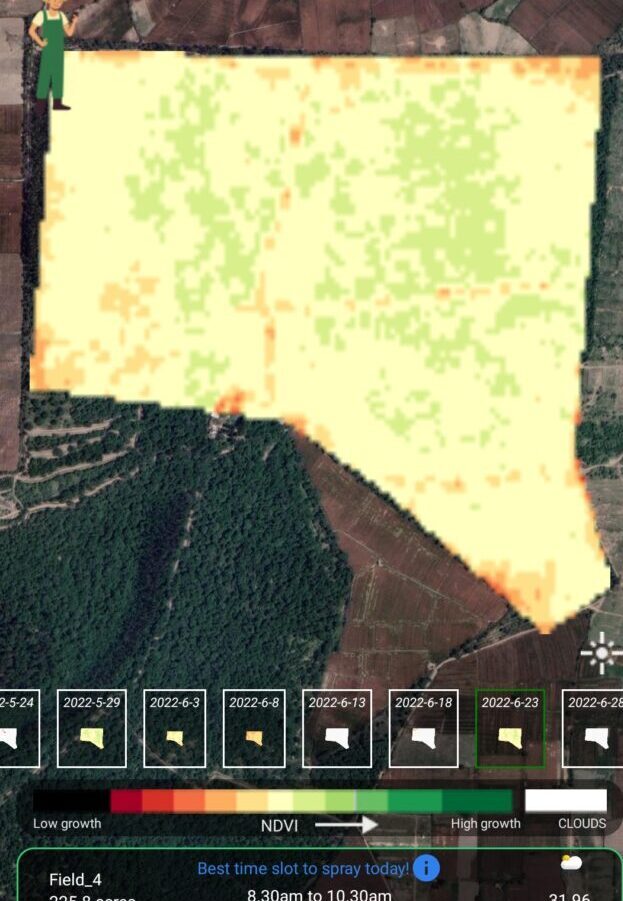
Although there are several vegetation indices, one of the most widely used is the Normalized Difference Vegetation Index (NDVI). NDVI values range from +1.0 to -1.0. Areas of barren rock, sand, or snow usually show very low NDVI values (for example, 0.1 or less). Sparse vegetation such as shrubs and grasslands or senescing crops may result in moderate NDVI values (approximately 0.2 to 0.5). High NDVI values (approximately 0.6 to 0.9) correspond to dense vegetation such as that found in temperate and tropical forests or crops at their peak growth stage.
We at EulersLab have been doing Satellite Imagery Analysis for NDVI calculation for our clients. Ikshana-Best Smart Farming is one such app we built to show NDVI analysis free for farmers.We used machine learning to built a innovative algorithm which studies prehistoric data and computes low yeild spots in a farm.
There are lot of studies and Statistical analysis done which proves correlation and linear regression analyses between yield and mean NDVI .Below video is example of our work for Ikshana.
Avesh